

Free Aug-2026 TDS-C01 Certification Sample Questions certification Exam
Certification Topics of TDS-C01 Exam PDF Recently Updated Questions
The Tableau TDS-C01 exam measures the candidate's knowledge of the fundamental concepts used by Tableau Desktop Specialists, such as creating a simple dashboard, creating and sharing basic reports, and how to connect data to Tableau Desktop. Other vital skills tested include creating meaningful relationships, organizing data, and working with metadata in specific contexts. Additionally, candidates must demonstrate proficiency in data aggregation, blending data, the appropriate use of calculations, and the ability to create charts and perform data analysis.
NEW QUESTION # 35
Using the Geo Data table, create a Bar chart showing the In-Stock percentage for each Color. What is the Average In-Stock percentage for the Color Red? Present your answer correctly upto 2 decimal places.
- A. 97.12%
- B. 96.46%
- C. 99.46%
- D. 95.12%
Answer: A
Explanation:
Not too tough. Follow along the steps:
Drag Color to Filter and choose Red:

3) Now to display the percentage correctly, lets format it. Click on the In Stock % pill in the Row shelf, and select format: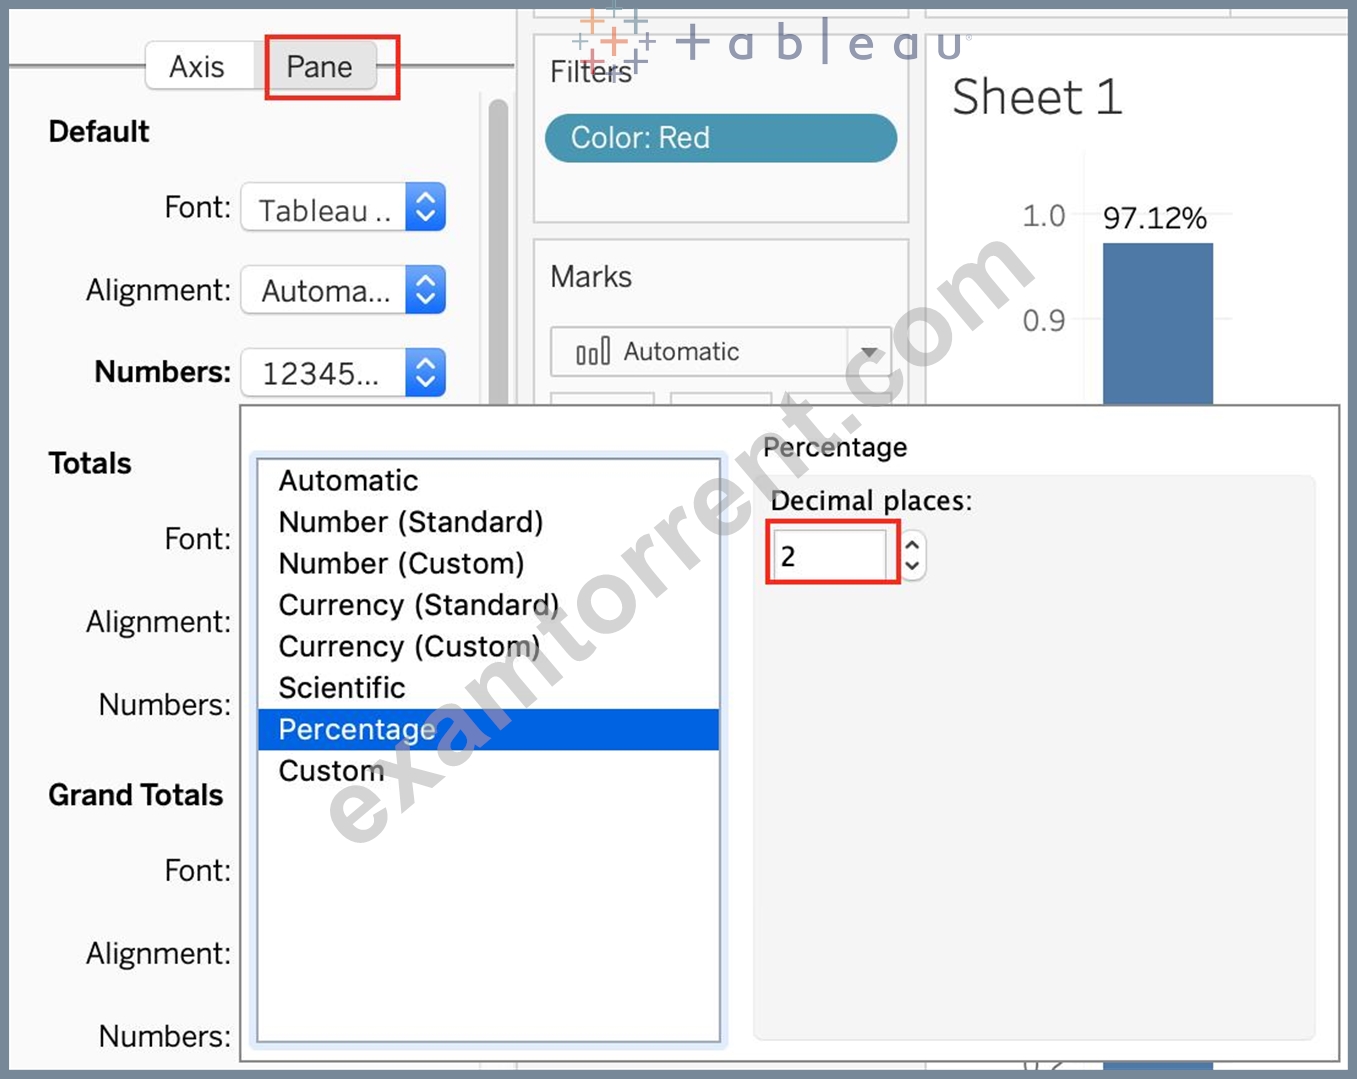
And your final view will look like :
NEW QUESTION # 36
Which of the following chart type makes use of 'binned' data?
- A. Histogram
- B. Treemaps
- C. Bullet chart
- D. Gantt Chart
Answer: A
Explanation:
A histogram is a chart that displays the shape of a distribution. A histogram looks like a bar chart but groups values for a continuous measure into ranges, or bins.
NEW QUESTION # 37
Which of the following is the correct way to calculate Profit Ratio in Tableau?
- A. SUM(Profit) / SUM(Sales)
- B. Sales / Profit
- C. SUM(Sales)/SUM(Profit)
- D. Profit / Sales
Answer: A
Explanation:
THIS IS A VERY IMPORTANT QUESTION
Aggregation is an important concept to consider when creating calculated fields. A calculated field for SUM([Profit]) / SUM([Sales]) will give you a very different answer than [Profit] / [Sales], even though both formulas are valid.
If you do not provide the aggregation within the calculated field, Tableau will calculate the equation for every record ( row ) in your analysis, then aggregate the answers for all of the rows together when the calculated field is added to the view.
In simple terms, if specify the aggregation such as SUM, what Tableau will do is that it will first calculate the sum of the Profit column ( say x ), then calculate the sum of the Sales column ( say y ), and then simply apply x/y ---> This is what we expect! Perfect!
BUT, if you don't specify the aggregation, it will go to every single ROW, perform Profit / Sales, and then aggregate the answers calculated for each row. This is simply NOT what we wan't!
An example:
NEW QUESTION # 38
Yes or No: The number of marks will increase when you increase the number of Dimensions in a view
- A. No
- B. Yes
Answer: B
Explanation:
Of course! As an example, see below:
1) Using the Sample Superstore data, let's plot a bar chart showing the Sales for each Category:
Observe that we have 3 marks - Each bar in a bar chart is called a mark. Similarly, each point in a scatter plot is also a mark , and so on for all charts.
1 row by 3 columns means that clearly on the y-axis (Sales), we have only a single mark - a single continous axis, but 3 different marks (Technology, Furniture and Office supplies ) on the x-axis.
2) Now let's add subcategory to the view as well (another dimension):
Observe that the number of marks has increased - i.e the number of Bars.
Also, notice we now have 1 row and 17 columns. Simply because 1 row = Sales (on the y-axis), and on the x-axis, we have 17 different columns (i.e product sub categories!!)
NEW QUESTION # 39
What is a story point in Tableau?
- A. A single worksheet or dashboard
- B. A collection of dashboards
- C. A collection of both worksheets and dashboards
- D. A collection of worksheets
Answer: A
Explanation:
In Tableau, a story is a sequence of visualizations that work together to convey information. You can create stories to tell a data narrative, provide context, demonstrate how decisions relate to outcomes, or to simply make a compelling case.
A story is a sheet, so the methods you use to create, name, and manage worksheets and dashboards also apply to stories (for more details, see Workbooks and Sheets). At the same time, a story is also a collection of sheets, arranged in a sequence. Each individual sheet (worksheet or dashboard) in a story is called a story point.
When you share a story -for example, by publishing a workbook to Tableau Public, Tableau Server, or Tableau Online-users can interact with the story to reveal new findings or ask new questions of the data.
NEW QUESTION # 40
You have the following visualization.
Where should you place a field named Region to show multiple distinct lines on the same axis?
- A. Path on the Marks card
- B. Color on the Marks card
- C. The Columns shelf
- D. The Rows shelf
Answer: B
Explanation:
To display multiple distinct lines on the same axis in Tableau, you should drag the Region field to the Color option on the Marks card. This will create separate lines for each region, each with a different color, allowing you to see multiple lines on the same axis and easily distinguish them.
Placing Region on Rows or Columns would change the layout, and using Path is typically for line ordering within a single line rather than creating distinct lines.
NEW QUESTION # 41
How can you access options to apply bold formatting to an axis in the view?
- A. Select Field Labels on the Format menu.
- B. Right-click on the Field and select Format.
- C. Select Text on the Marks card.
- D. Right-click on the axis.
Answer: D
Explanation:
Next we want to make some changes to the percentage numbers on the Y (vertical) axis.
1. Right click the vertical (value) axis. Select Format Axis. This opens the Format Axis pane.
2. Click Number from the list of options. The commands in this section of the Format Axis pane are used to format numbers that appear on the selected axis of the chart.
3. Click in the Decimal places input box and change the value to 1.
4. Select Axis Options. Change the Minimum Bound to .05 to make the differences in the columns more dramatic. The Format Axis pane should match Figure 4.28.
5. Click the Close button at the top of the Format Axis pane.
6. Save your work.
https://openoregon.pressbooks.pub/beginningexcel/chapter/4-2-formatting-charts/
NEW QUESTION # 42
Are animations enabled by default in Tableau?
- A. Yes
- B. No
Answer: B
Explanation:
Explanation
No, by default, animations are not enabled in Tableau.
We can animate visualizations to better highlight changing patterns in your data, reveal spikes and outliers, and see how data points cluster and separate.
Animations visually transition between filter, sort, and zoom settings, different pages, and changes to filter, parameter, and set actions. As visualizations animate in response to these changes, viewers can more clearly see how data differs, helping them make better informed decisions.
When you author animations, you can choose between two different styles: simultaneous or sequential. Here are examples of each type.
1) Simultaneous animations
The default simultaneous animations are faster and work well when showing value changes in simpler charts and dashboards.
2) Sequential animations
Sequential animations take more time but make complex changes clearer by presenting them step-by-step.
To Animate visualizations in a workbook:
1) Choose Format > Animations.
2) If you want to animate every sheet, under Workbook Default, click On. Then do the following:
For Duration, choose a preset, or specify a custom duration of up to 10 seconds.
For Style, choose Simultaneous to play all animations at once or Sequential to fade out marks, move and sort them, and then fade them in.
3) To override workbook defaults for a particular sheet, change the settings under Selected Sheet.
NEW QUESTION # 43
You create the following visualization.
What is the first step to create the visual grouping of the 10 marks shown in blue?
- A. Create a Group on the Property Description field in the Data pane
- B. Select the desired 10 marks in the view
- C. Select the desired 10 text labels under Property Description
- D. Create a Set on the Neighborhood field in the Data pane
Answer: B
Explanation:
To create a visual grouping of the top 10 marks shown in blue, the first step is to select the desired 10 marks directly in the view. Once selected, you can then use options such as creating a group or set from the selected marks to differentiate them visually in the chart. This selection method provides an efficient way to highlight or isolate specific data points based on the view itself.
NEW QUESTION # 44
Which of the following are true about dimensions?
- A. They contain qualitative values (such as names, dates, or
geographical data) - B. They affect the level of detail in the view
- C. Dates are mostly placed in dimensions by default for relational data sources
- D. They contain contain numeric, quantitative values
Answer: A,B,C
Explanation:
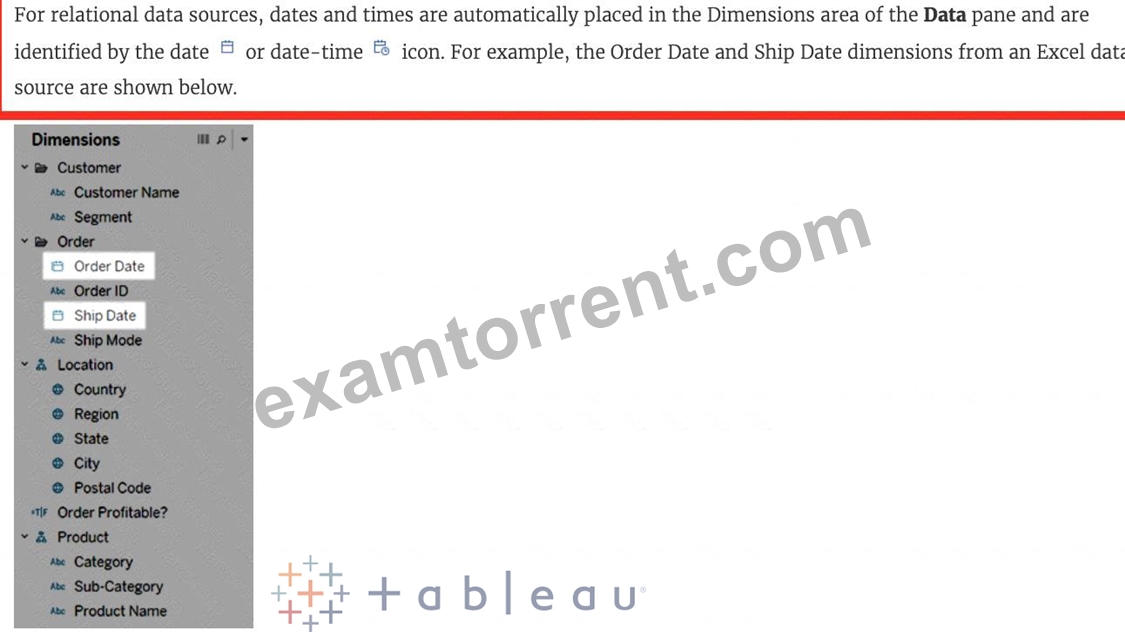
Measures contain numeric quantitative values hence that option is incorrect.
Reference 1: https://help.tableau.com/current/pro/desktop/en-us/datafields_typesandroles.htm Reference 2: https://help.tableau.com/current/pro/desktop/en-us/dates.htm
NEW QUESTION # 45
You can use the __________________ in Tableau to clean / organise your data.
- A. Data manager
- B. Data cleaner
- C. Data interpreter
- D. Data organiser
Answer: C
Explanation:
When you track data in Excel spreadsheets, you create them with the human interface in mind. To make your spreadsheets easy to read, you might include things like titles, stacked headers, notes, maybe empty rows and columns to add white space, and you probably have multiple tabs of data too.
When you want to analyze this data in Tableau, these aesthetically pleasing attributes make it very difficult for Tableau to interpret your data. That's where Data Interpreter can help.
NEW QUESTION # 46
To connect Tableau to a CSV data source what type of connection should you use?
- A. JSON
- B. Excel
- C. Text
- D. Spatial
Answer: C
Explanation:
Tableau recognises a CSV file as a TEXT file, and therefore it is the correct option.
The following are the steps to import a CSV file:
1) From the data connection screen, click on Text:
2) Choose the appropriate file, and click Open:
3) Finally, Tableau imports the data as shown below:
NEW QUESTION # 47
Which of the following 2 columns CANNOT be deleted in Tableau?
- A. Calculated Fields
- B. Number of Records
- C. Measure Names
- D. Measure Values
Answer: C,D
Explanation:
Measure names and values CANNOT be deleted in Tableau like other columns can. These are auto-generated.
Calculated Fields, and Number of records can both be deleted.
NEW QUESTION # 48
How can you format numbers in Tableau as currency?
- A. Right-click on the Sheet name and select Format. Then in the Format pane, click the Numbers drop-down menu.
- B. Right-click a dimension in the view and select Format. Then in the Format pane, click the Numbers drop-down menu.
- C. Right-click on the data source used in the view and select Format. Then in the Format pane, click the Numbers drop-down menu.
- D. Right-click a measure or axis in the view and select Format. Then in the Format pane, click the Numbers drop-down menu.
Answer: D
Explanation:
According to the official Tableau documentation:
NEW QUESTION # 49
In which of the following scenarios would having a live connection be more beneficial than using an extract?
- A. Analyzing real time data from production systems
- B. Analyzing and tracking real time flight updates
- C. Analyzing historical housing prices
- D. Analyzing real time stock prices
- E. Analyzing a subset of a dataset having 1 billion rows
Answer: A,B,D
Explanation:
Extracts would be more beneficial for analyzing historical prices where we won't be making use of any real time data being streamed. Same is the case for enormous datasets having billions of rows (extracts will be more efficient in analyzing subsets of such large data).
As for live stock prices, flight updates, real time updates from production or mission critical systems - having a live connection is the most logical choice, since we need access to the most fresh and recent data possible at all times!
NEW QUESTION # 50
True or False: A LEFT JOIN or INNER JOIN creates a row each time the join criteria is satisfied, which can result in duplicate rows. One way to avoid this is to use data blending instead.
- A. True
- B. False
Answer: A
Explanation:
Joins combine tables by adding more columns of data across similar row structures. This can cause data loss or duplication if tables are at different levels of detail, and joined data sources must be fixed before analysis can begin.
Inner join
Left Join
Blends, unlike relationships or joins, never truly combine the data. Instead, blends query each data source independently, the results are aggregated to the appropriate level, then the results are presented visually together in the view.
NEW QUESTION # 51
What are two correct methods for creating a visual group? Choose two.
- A. Right-click a dimension in the Data pane.
- B. Select marks in the view.
- C. Drag a dimension onto another dimension in the Data pane.
- D. Click the drop-down arrow from the top of the Data pane.
Answer: A,B
Explanation:
Two correct methods for creating a visual group are selecting marks in the view and right-clicking a dimension in the Data pane. A visual group is a way of combining related members in a dimension field to create categories or segments in your data. For example, you can create a visual group by selecting several states in a map view and grouping them into regions. You can create a visual group by selecting one or more marks in the view and then clicking the group icon on the tooltip or on the toolbar. This will create a new group field in the Data pane with default names for each group based on their members. You can also create a visual group by right-clicking a dimension in the Data pane and selecting Create > Group. This will open the Create Group dialog box where you can select several members and drag them into groups with custom names8 The other options are not correct methods for creating a visual group. Clicking the drop-down arrow from the top of the Data pane will open a menu with options for creating new fields, folders, sets, bins, etc., but not groups. Dragging a dimension onto another dimension in the Data pane will create a hierarchy, which is a way of organizing data into different levels of detail, not groups9
NEW QUESTION # 52
In Tree maps, the size begins with the largest rectangle on the ________________ and the smallest rectangle on the ________________.
- A. top left bottom left
- B. top left, bottom right
- C. top right, bottom left
- D. top right, bottom right
Answer: B
Explanation:
Tree maps size begins from maximum in top left to smallest in bottom right.
See below to learn how to create a TreeMap and add colours to it:
NEW QUESTION # 53
You just added this field to the Columns shelf.
What will this create?
- A. A vertical header
- B. A horizontal axis
- C. A horizontal header
- D. A vertical axis
Answer: B
Explanation:
We know that continuous fields will always create an axis, so options stating 'header' are automatically eliminated. For our question, see below:
Had the question asked us to place this pill on the Rows shelf instead, we would've gotten a different answer:
NEW QUESTION # 54
Which of the following would you use to edit the Shape, colour, and Text of your visualisations?
- A. Marks Card
- B. Filter Shelf
- C. Analytics Pane
- D. Data Pane
Answer: A
Explanation:
The Marks Card allows us not only to edit the Shape, Text and Colour, but also to modify the Tooltip and the level of detail of the visualisation!
The Marks card is a key element for visual analysis in Tableau. As you drag fields to different properties in the Marks card, you add context and detail to the marks in the view.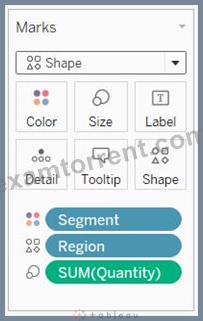
You use the Marks card to set the mark type (see Change the Type of Mark in the View), and to encode your data with color, size, shape, text, and detail. To change the mark settings, see Control the Appearance of Marks in the View.
In this example, three different fields have been dragged to different properties in the Marks card. Segment is on Color, Region is on Shape, and Quantity is on Size.
After you add a field to the Marks card, you can click the icon next to the field to change the property it is using. You can also click the property buttons in the Marks card to change those settings.
Many properties can have multiple fields. For example, you can add multiple fields to Label, Detail, Tooltip, and Color. Size and Shape can only have one field at a time. For more details, see Control the Appearance of Marks in the View.
NEW QUESTION # 55
Using the dataset provided, create a crosstab showing the Profit of each Region per Year, then add grand totals to the view. What was the total Profit for Canada in 2012 and the total Profit for Canada for 2011 through
2014, respectively?
- A. 52,678 and 311,404
- B. 4,888 and 17,817
- C. 1,807 and 34,571
- D. 5,129 and 88,872
Answer: B
Explanation:
To reach the correct answer, follow these steps:
1) Drag Order Date (Discrete Year) to the Column shelf, and Region to the Row Shelf as shown:
2) Drag Profit to Text in the Marks Shelf as shown:
3) Click on Analysis as shown -> Totals -> SELECT ROW GRAND TOTALS
The following will be the final view:
You could also Filter by Region to only Focus on Canada, but that's your choice: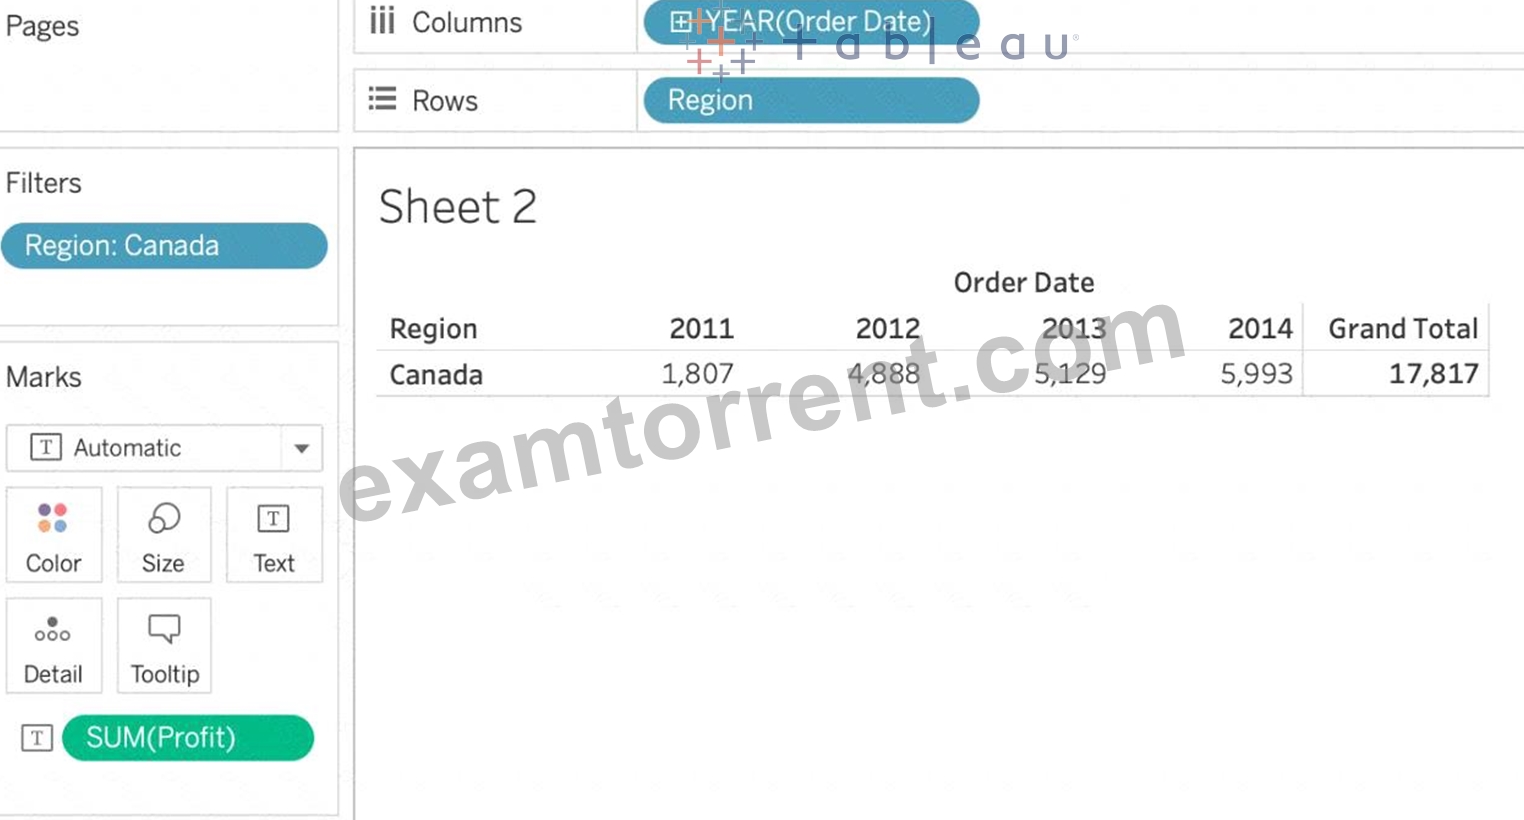
THEREFORE,
2012 = 4,888
2011 -> 2014 = 17,817
NEW QUESTION # 56
......
2026 New Preparation Guide of Tableau TDS-C01 Exam: https://vcetorrent.examtorrent.com/TDS-C01-prep4sure-dumps.html
